Dashboard
In this section, you get an overview of what is happening on the platform. For example, request statistics, new feature developments via release notes, virtual datasets, and the change feed are displayed. Some elements are interactive; clicking or hovering over them provides additional information or redirects you to the relevant sections.
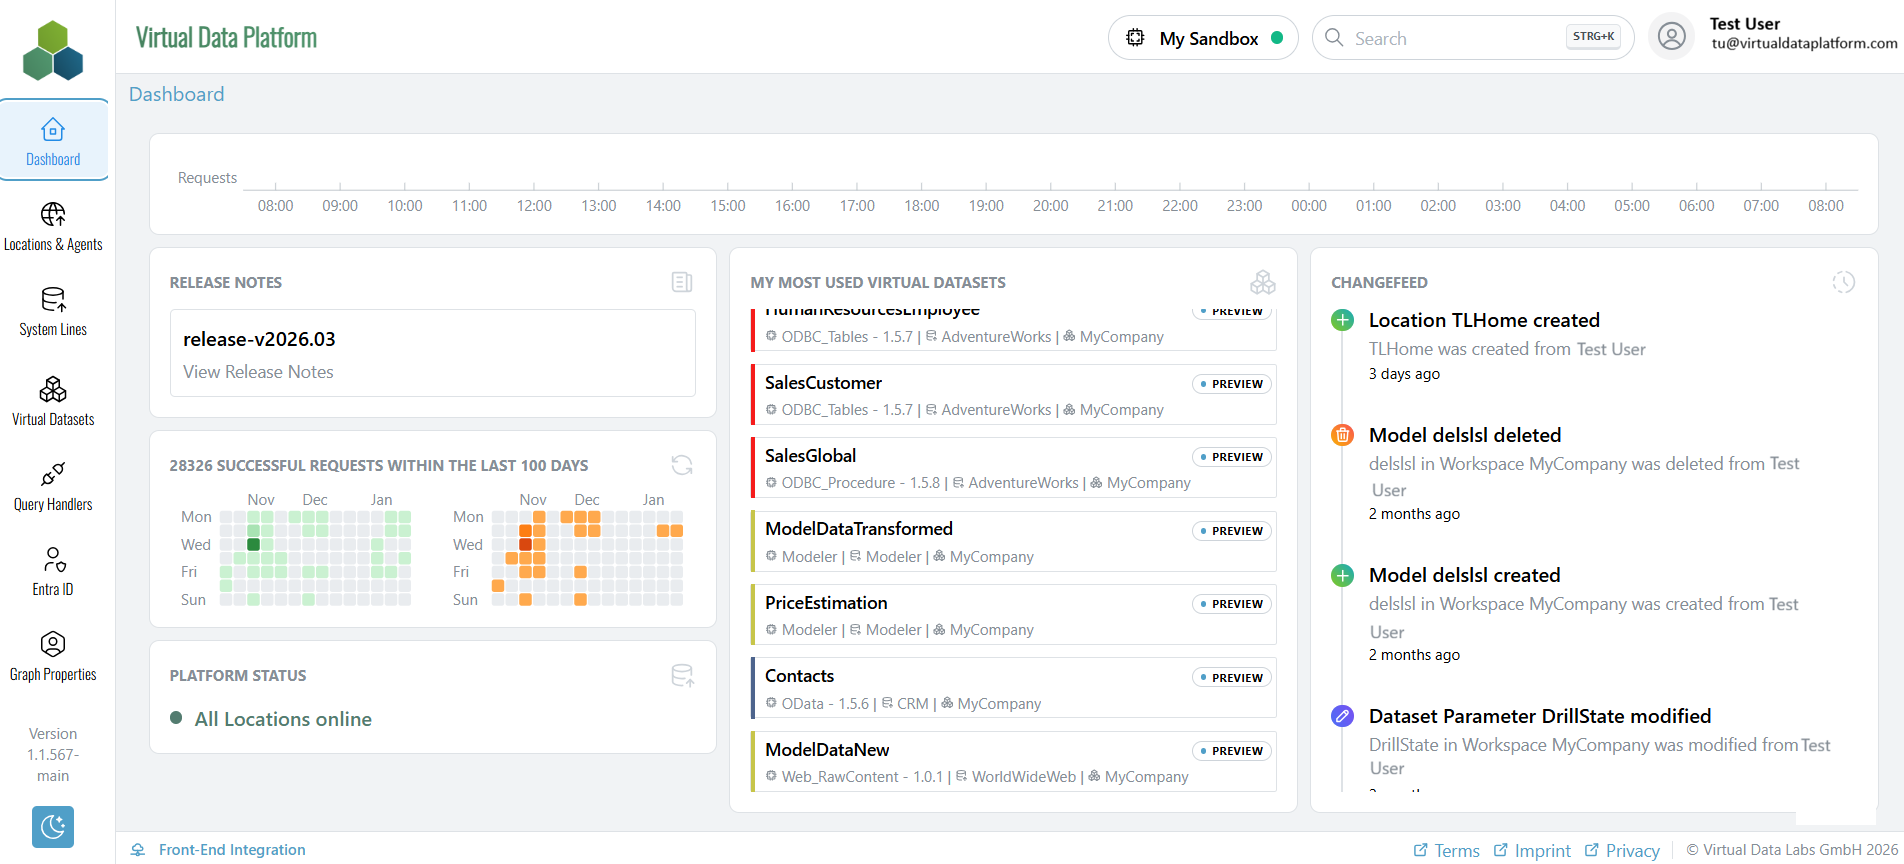
Requests: The requests timeline shows a time series of requests from the last 24h.
Release Notes: Provides a link to the most recent developments in the documentation of the Virtual Data Platform.
Request Statistics: Below the Release Notes link, a statistic shows information about successful and unsuccessful requests over the last days.
Most Used Virtual Datasets: The list shows the most frequently used Virtual Datasets, ordered from top to bottom. Clicking on an entry takes you directly to the corresponding Virtual Dataset.
Changefeed: Allows tracking of the most recent changes, including who made them and when.
Platform Status: Provides information about the locations that are currently online.